
Guest WiFi plays an essential role in most venues. Any downtime or interruption in connection can severely disrupt both the guest experience and critical business operations. This is why maintaining the optimal performance of a Guest WiFi service should be a top priority.
UpWiFi is a simple, scalable solution by offering an automated way to monitor your Guest WiFi's key metrics in realtime.
This tool offers an easy-to-use and cost-effective way to track key Guest WiFi parameters, and gain the insights you need for faster WiFi troubleshooting.
Access all metrics via all familiar Zabbix interface.
Reduce the frequency and duration of performance bottlenecks and downtime.
Enjoy strong data gathering and real-time graphing capabilities of Zabbix.
Monitor your Guest WiFi's key metrics in realtime
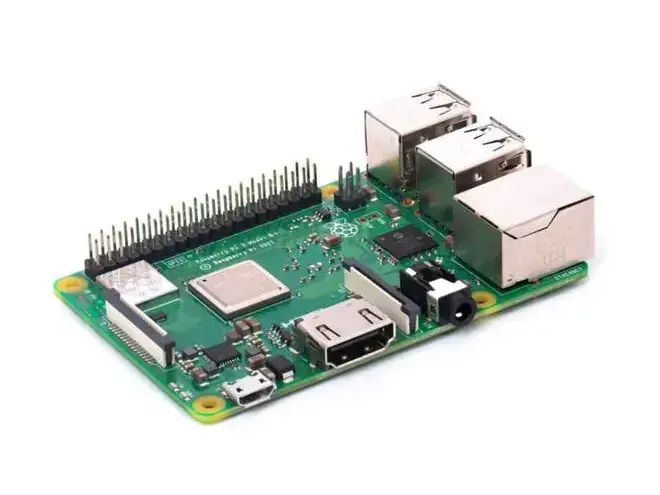
Installing UpWiFi is pretty much plug-and-play.

Get insights from your Guest WiFi network and monitor performance in real-time.
Receive problem notification to detect and resolve issues faster.
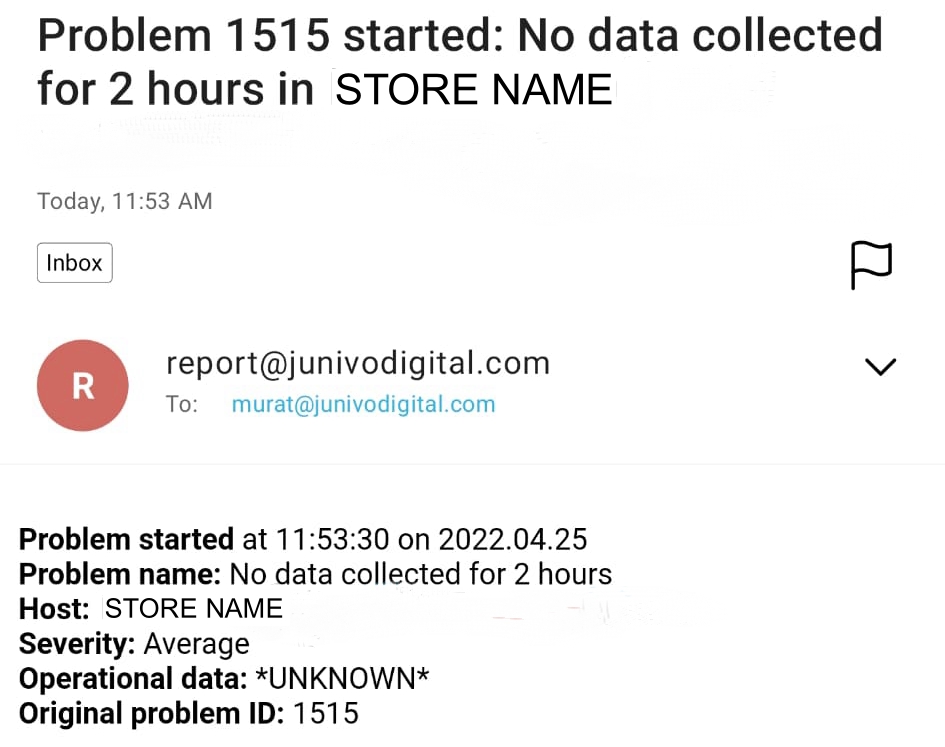

Zabbix is an enterprise-class open source distributed monitoring solution. It has flexible notification mechanism that allows users to configure e-mail based alerts for virtually any event.